UZ Soil Properties Editor
To solve Richards equation two important hydraulic functions are required for all soil types which characterise the individual soil profiles within the model area:
This information, along with the following parameters, is stored in the soil property database:
- soil moisture at saturation (\(\theta\)s) [-]
- soil moisture at effective saturation (\(\theta\)eff) [-]
- capillary pressure at field capacity (\(pF_{fc}\))
- capillary pressure at wilting point (\(pF_W\))
- residual soil moisture content (\(\theta\)r) [-]
- saturated hydraulic conductivity (\(K_s\))
The soil moisture at effective saturation \(\theta\)eff is the maximum achievable soil moisture content.
1. Definitions of soil properties
pF scale
pF is a log scale for representing soil matric potential. Thus,
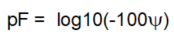
Equation 17.01
where
- \(\Psi\) is the matric potential in metres of water
Note
\(\Psi\) is always negative under unsaturated conditions. For example, if your measured wilting point is -15 bar (-152.96 m water), then the pF value is 4.2.
Saturated moisture content - \(\theta_s\)
This is the maximum water content of the soil, which is equal to the porosity. A typical saturated moisture content is about 0.25 to 0.3.
Effective saturation
This is the maximum water content achieved under field conditions, which is usually slightly less than the saturated moisture content because of entraped air.
Field capacity - \(\theta_{fc}\)
This is the water content of a free draining soil. In other words, it is the water content in the soil 2-3days after a heavy soaking rain. A typical field capacity is about 0.1 to 0.2.
pFfc - This is the suction pression of a soil when it is at field capacity. The pFfc (field capacity) is used as the initial condition in the unsaturated flow module. A typical value is about 2.0.
Wilting point - \(\theta_{WP}\)
This is the water content when plants can no longer remove water from the soils and start to wilt. It is the minimum water content of the soil in the absence of evaporation. A typical value is about 0.01 to 0.05.
pFw - This is the suction pression of the soil when it is at the wilting point. The pFw (wilting) is typically about 4.2.
Residual moisture content - \(\theta_r\)
This is the minimum water content at very high suction pressures. A typical residual moisture content is on the order of \(10^{-3}\).
2. Soils Database
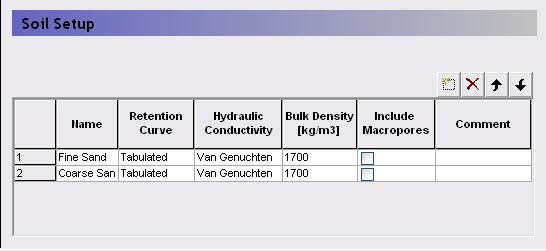
In the main soils database dialogue, you can add any number of soils. MIKE SHE only reads information on the soils being used, so there is no penalty for having large databases that include soils used in different projects.
Name - The Name field is used to identify the soil when loading the soil information in MIKE SHE’s UZ [Soil Profile Definitions) dialogue.
Retention Curve and Hydraulic Conductivity - The Soil Moisture Retention Curve and the Hydraulic Conductivity Function are described in the next sections.
Bulk Density - The bulk density is used for calculating sorption during water quality simulations.
Include Macropores - If [Macropore Flow) has been specified, then the macropore data will be required. If this item is checked, then an additional property page will be added to the data tree - Macropore Parameters .
Comment - This field can be used to provide meta data for the soil, such as the literature source for values, or the project that it was last used in.
Curves for the calculated Retention and Conductivity are shown for each defined soil.
3. Soil Moisture Retention Curve
The relationship between the water content, \(\theta\) and the matric potential, \(\psi\) is known as the soil moisture retention curve, which is basically a function of the texture and structure of the soil. The amount and type of organic material may also have an influence on the relationship. Characteristically, the pressure head decreases rapidly as the moisture content decreases. Hysteresis is also common, that is the relationship between \(\theta\) and \(\Psi\) is not unique but depends on whether the moisture content is increasing or decreasing. MIKE SHE allows for any shape of the soil moisture retention curve but does not take hysteresis into account (i.e. a unique relation between \(\theta\) and \(\Psi\) is assumed).
Typically, the soil moisture curve is measured in a laboratory or assumed based on typical values for similar soils. If laboratory data is available, the measured \(\theta\)-\(\Psi\) values can be input directly into MIKE SHE as tabular data. Intermediate values are then calculated by MIKE SHE, using a cubic spline method, and stored internally in the code. Alternatively, the measured values can be fitted to commonly used functional relationships. The appropriate function parameters can be input directly, or more refined tabular data may be generated externally to MIKE SHE (e.g. in MS Excel) and input as tabular data.
Several parametric forms of the soil moisture retention curve have been developed over the years. The MIKE SHE interface allows the user to specify two of the most common parametric forms.
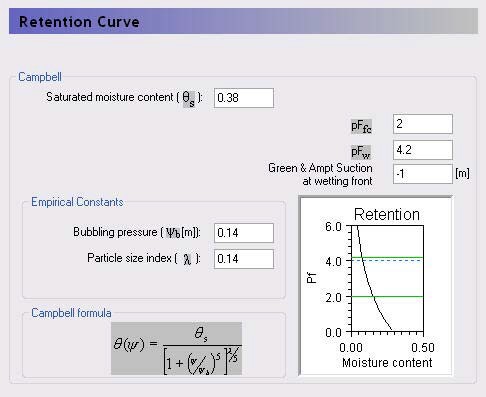
Common data
The upper part of the dialogue contains the common parameters for describing the soil-moisture relationship, which are described in the Definitions of soil properties section. The number of parameters in this section changes depending on the retention curve definition that was selected.
Green and Ampt suction - This is the empirical suction [metres of water] ahead of the wetting front in the Green and Ampt empirical relationship. It is essentially a calibration parameter but should be about the same as the soil suction value just below field capacity. In other words, when the soil has been freely drained, plus had some water removed by evapotranspiration.
Tabulated
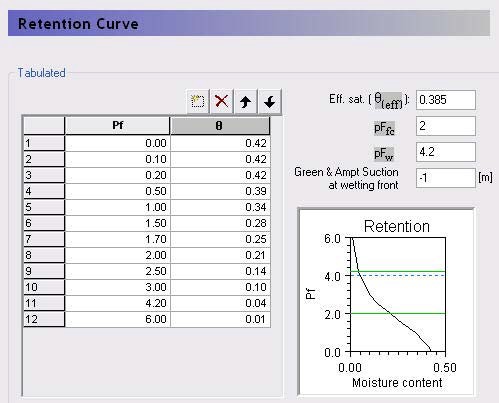
The data points describing the pressure conductivity curve can be given as a table of pF versus \(\theta\) (moisture content) values. The table should be specified starting with the lowest value of pF (wettest condition) and given in increasing order of pF (see pF scale).
To get a smooth retention curve MIKE SHE adopts a cubic spline curve fitting procedure. As a minimum, you should specify the conductivity at saturation, the field capacity and the wilting point. However, we strongly advise against this because the cubic spline function is unlikely to be able to fit an appropriate function to only 3 points.
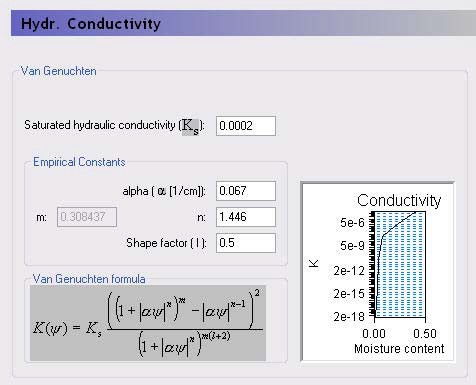
Van Genuchten Function
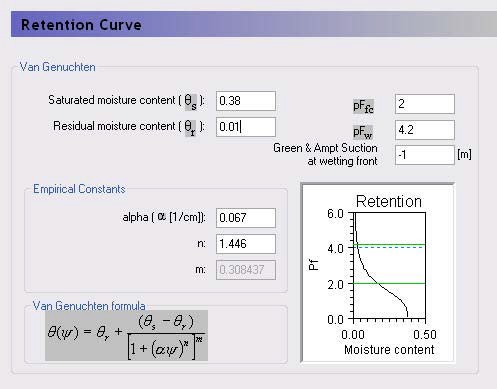
The Van Genuchten formula is the most widely used soil moisture-pressure relationship. The Van Genuchten formula was first published by M. Th. van Genuchten in 1980, in his classic paper.
A closed-form equation for predicting the hydraulic conductivity of unsaturated soils. Soil Science Society of America Journal 44 (5): 892–898.
The Van Genuchten formula is:
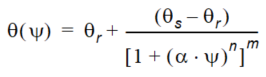
Equation 17.02
where
- \(\alpha\) is the other Van Genuchten empircial constant
- the exponent \(m\) is related to the empirical constant \(n\) by \(m=1-\frac{1}{n}\)
Both \(n\) and \(a\) can be optimized using AUTOCAL program.
Note
It is important to note that the data is tabulated internally and stored in the same form as if tabulated data were input using about 100 points.
Campbell Function
Note
It is important to note that the data is tabulated internally and stored in the same form as if tabulated data were input using about 100 points.
4. Hydraulic Conductivity Function
The Governing Equation for the unsaturated flow requires information about two hydraulic functions: The hydraulic conductivity function, \(K(\theta)\) and the soil moisture retention curve \(\psi(\theta)\) are important.
The hydraulic conductivity decreases strongly as the moisture content \(\theta\) decreases from saturation. This is not surprising since the total cross-sectional area for the flow decreases as the pores are getting filled with air. In addition, when a smaller part of the pore system is available to carry the flow, the flow paths will become more tortuous. Also, there is an increase of the viscosity of the water, when the short-range adsorptive forces become dominant in relation to the capillary forces.
The experimental procedure for measuring the \(K(\theta)\) function is rather difficult and not very reliable. Alternatively, procedures have been suggested to derive the function from more easily measurable characterizing properties of the soil or simply rely on empirical relationships.
Reviews of various methods for predicting the conductivity function can be found in the literature.
Tabulated
The data points describing the pressure conductivity curve can be given as a table of \(pF\) versus \(K\) values. The table should be specified starting with the lowest value of pF (wettest condition) and given in increasing order of pF.
To get a smooth hydraulic conductivity curve, MIKE SHE adopts a cubic spline curve fitting procedure. As a minimum, you should specify the conductivity at saturation, the field capacity and the wilting point. However, we strongly advise against this because the cubic spline function is unlikely to be able to fit an appropriate function to only 3 points.
Averjanov Function
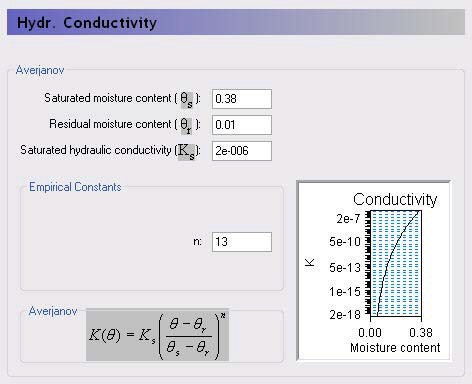
In the Averjanov method, the hydraulic conductivity, \(K\), is described as a function of the effective saturation, \(Se\):
Equation 17.03
Where
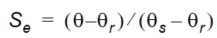
Equation 17.04
in which:
- \(\theta\)s, \(\theta\) and \(\theta\)r are saturated, actual and residual moisture contents, respectively
The full knowledge about the hydraulic conductivity function is seldom available, and the parameter n has to be estimated by calibration.
As a guideline the exponent n is usually small for sandy soils (2-5) and large for clayey soils (10-20). It is important to note that the value of the exponent n will influence the percolation rate in the soil and thereby influence the actual evaporation rate.
Note
It is important to note that the data is tabulated internally and stored in the same form as if tabulated data were input using about 100 points.
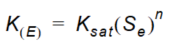
Van Genuchten Function
In addition to the tabulated values, parametric functions are available using the Van Genuchten and the Campbell/Burdine formulations. It is important to note that the data is tabulated internally and stored in the same form as if tabulated data were input.
The van Genuchten Shape Factor, \(l\), is soil texture dependent, with a minimum allowed value of -4.
Note
It is important to note that the data is tabulated internally and stored in the same form as if tabulated data were input using about 100 points.
Campbell/Burdine Function
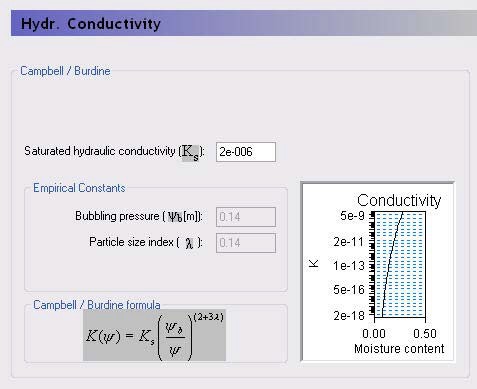
Note
It is important to note that the data is tabulated internally and stored in the same form as if tabulated data were input using about 100 points.
5. Macropore Parameters
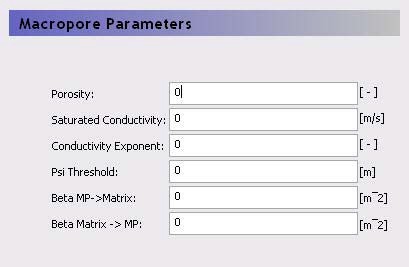
The macropore parameters are used for the full macropore flow in the unsaturated zone.
Porosity - is the macropore porosity.
Saturated conductivity - is the saturated conductivity of the macropores.
Conductivity exponent - is the exponent, n, in Equation 31.35, which represents the simple power function assumed for the conductivity-water content relationship.
Psi threshold - is the capillary pressure in the matrix above which flow in the macropores can occur. Pressures below this value would result in water being absorbed into the matrix via capillarity.
Beta - is the mass transfer rate between the macropores and the matrix.