Preprocessed Data Tab
1. Overview
In the Setup Tab, you specify the input data required by the model - including the size of the model and the numerical grid. However, most of the setup data is independent of the model extent and grid. When you pre-process, your model set up, MIKE SHE’s pre-processor program scans through your model set up and interpolates all spatial data to the specified model grid. This interpolated set up data is stored in a .fif file, which is read during the simulation by the MIKE SHE engine. However, the pre-processed data does not include any time information. All time series information must be interpolated dynamically during the run because MIKE SHE dynamically changes the time step during the simulation in response to stresses on the system.
The Preprocessed Data Tab is used to display the pre-processed data.
Before you run your simulation, you should carefully check the preprocessed data for errors. Errors found in the preprocessed data are typically related to incorrectly specified parameters, file names, etc. in the Setup Tab.
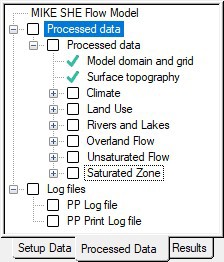
The Preprocessed Tab includes a data tree with two items:
2. Processed Data
On the main pre-processed dialog, there is an un-editable textbox containing the file and location of the pre-processed data. This is a .pfs ASCII file containing the file references for all of the data. The actual data is stored in a .fif file, as well as a number of dfs2 and dfs3 files.
After you have successfully preprocessed your model, the pre-processed data will be automatically loaded when you expand the data tree. The data tree reflects all the spatial data defined in the model set up tab. In other words, if the overland flow is not included in the Simulation Specification dialogue, then the Overland item will not be included in the pre-processed data tree.
Note
If you change your model setup data, the pre-processed data will not reflect the changes until you pre-process your model again.
a. Viewing the pre-processed data
In all map and time series views, there is an edit button. This edit button will open the dfs0, dfs2 or dfs3 file that was generated by the pre-processor in either the Grid Editor or the Time Series Editor.
In all map views, there is also a view button. This view button will open the dfs2 or dfs3 file that was generated by the pre-processor in the results viewer.
Each of these files usually contains a large number of data items. The Grid- or the Time Series Editor opens at the first item, so you must use the scrolling function in the editor to find the data item that you want. In the results viewer the selected item will be displayed right away.
b. Editing the pre-processed data
MIKE SHE reads only the .fif file during the simulation. The .dfs2 and dfs3 files are created to make it easier to view and plot the preprocessed data. If you edit the dfs2 or dfs3 files, the changes will not be used in the simulation.
If you want to change the pre-processed data and use the changed data in the simulation, you have a couple of options.
Option 1
- Right click on the map view and save the data to a new dfs2 file,
- open the new dfs2 file in the Grid Editor, and
- make the changes in the new dfs2 file and save the file.
Option 2
- Use the edit button to open the dfs2 or dfs3 pre-processed file in the Grid Editor,
- make your changes in the file, and
- save the file with a new name.
In both options above, you then use the new dfs2 or dfs3 file as input in the Setup tab.
c. Rivers
The coupling between the river model and MIKE SHE is made via river links, which are located on the edges that separate adjacent grid cells. The river link network is created by the pre-processor, based on the river model coupling reaches. The entire river system is always included in the hydraulic model, but MIKE SHE will only exchange water with the coupling reaches.
The location of each of MIKE SHE river link is determined from the co-ordinates of the river points, where the river points include both digitised points and H-points on the specified coupling reaches. Since the MIKE SHE river links are located on the edges between grid cells, the details of the river geometry can be only partly included in MIKE SHE, depending on the MIKE SHE grid size. The more refined the MIKE SHE grid, the more accurately the river network can be reproduced. This also leads to the restriction that each MIKE SHE grid cell can only couple to one coupling reach per river link. Thus, if, for example, the distance between coupling reaches is smaller than half a grid cell, you will probably receive an error, as MIKE SHE tries to couple both coupling reaches to the same river link.
The river links are shown on Rivers and Lakes data tree pages, as well as the SZ Drainage to River page.
d. Land Use
The vegetation distribution is displayed on a map, but if you use the vegetation database for specifying the crop rotation, this information will not be displayed in the pre-processor.
e. Unsaturated Flow
The Unsaturated Flow data tree in the pre-processed data contains two noteworthy data items.
Soil profiles
Under the unsaturated zone, you will find a map with the grid codes for each of the soil profiles used. Accompanying this map is a text page containing the details of all the soil profiles. At the top of this page is the path and file name of the generated txt file, which you can open in any text editor.
Note
If you are using one of the finite difference methods, the pre-processor modifies the vertical discretisation wherever the vertical cell size changes.
Thus, if you have 10 cells of 20cm thickness, followed by 10 cells of 40cm thickness, the location of the transition will be moved such that the two cells on either side will have an equal thickness. In this case, cells 10 and 11 will both be 15cm.
UZ Classification Codes
If certain conditions are met, then the flow results for a 1D unsaturated zone column can be applied to columns with similar properties. If you chose to use this option, then a map will be generated that shows the calculation cells and the corresponding cells to which the results will be copied.
The cell with a calculation is given an integer grid code with a negative value. The flows calculated during the simulation in the cells with the negative code, will be transferred to all the cells with the same positive grid code value. For example, if an UZ recharge to SZ of 0.5 m3/day is calculated for UZ grid code -51, then all the SZ cells below the UZ cells with a grid code of +51 will also be given the same recharge.
Tip
This map can be difficult to interpret without using the Grid Editor.
g. Saturated Flow
The saturated zone data is generally written to a dfs3 file. In the map view, there is a combo box where you can specify the layer that you want to view.
Saturated Zone Drainage
The rate of saturated zone drainage is controlled by the drain elevation and the drain time constant. However, the destination of the drainage water is controlled by the drain levels and the drain codes, which determine if the water flows to a river, a boundary, or a local depression. The algorithm for determining the drainage source-recipient reference system is described in Groundwater drainage.
During the preprocessing, each active drain cell is mapped to a recipient cell. Then, whenever drainage is generated in a cell, the drain water will always be moved to the same recipient cell. The drainage source-recipient reference system is displayed in the following two grids.
Drainage to local depressions and boundary - This grid displays all the cells that drain to local depressions or to the outer boundaries. All drainage from cells with the same negative value are drained to the cell with the corresponding positive code. If there is no corresponding positive code, then that cell drains to the outer boundary, and the water is simply removed from the model. Cells with a value of zero either do not generate drainage, or they drain to a river link.
Drainage to river - This grid displays all of the cells that drain to river links. All drainage from cells with the same negative value are drained to the cell with the corresponding positive code. Cells with a value of zero either do not generate drainage, or they drain to an outer boundary or a local depression.
h. Related Items:
3. Log Files
The log files section contains a view of two log files from the preprocessor. The "PP Log File" contains messages, warnings and errors. This is the file created in the same folder as the .she file. It is also displayed in the simulation tab when running the preprocessor. The "PP print log file" contains additional details. It is created in the results directory.