The Results Viewer
The Results Viewer is a generic MIKE Zero tool for displaying both gridded and unstructured spatial data. For more information on the Results Viewer, see the separate MIKE Zero documentation.
This chapter highlights some of the specific functionality for MIKE SHE.
1. Saturated Zone Cross-section Plots
To display a cross-section plot of a set of 3D gridded data, you must click on the Profile icon,  . Clicking on this icon will allow you to interactively define a cross-section by left-clicking at each vertex of the profile line and double-clicking to close the profile.
After closing the profile, the following dialogue will be displayed listing the available output items.
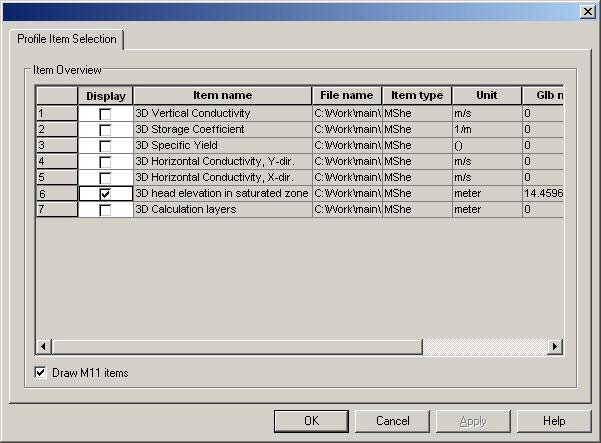
Only one output item can be selected. After selecting your item, click OK and the profile will be displayed.
You can modify the plot by right clicking on the plot and selecting Properties form the pop-up menu.
Saving and loading profiles
If you have a profile open, under the View/Profile item in the top menu bar, you can save the current profile location. This allows you to create standard profiles for comparing scenarios.
To load a saved profile, make the plan view plot active, by either minimizing or closing open profile plots. The View/Profile/Load option becomes active, and you can load a saved profile and select the profile item normally.
2. UZ Specific Plots
UZ Scatter and Filled Plots
For unsaturated zone results, scatter or filled plots can be generated. UZ Scatter and Filled Plots are only different for simulations that do not use the “calculation in all cells” UZ module option.
This option is no longer recommended and is essentially obsolete.
Transient UZ Column Plot
UZ Plots can only be extracted from simulated unsaturated zone water contents and flow. This is because UZ plots display results for a single column for all of the UZ calculation nodes in the column. Other simulated UZ results show net values for the entire UZ (i.e., infiltration, recharge to the SZ, etc.).
After selecting the UZ Plot extractor tool move the cursor over the column you want to extract the results from and double-click. The UZ Plot shows either water content, the pressure or the saturation for each node in the column (y-axis) for the entire simulation period (x-axis).
Addition graphical functions can be accessed by right-clicking in the graphical view. Modifications that can be made include changing the interpolation methods, adding the mesh, adding isolines,
Results from multiple UZ columns cannot be displayed on the same UZ Plot.