Kristensen and Jensen method
The primary ET model is based on empirically derived equations that follow the work of Kristensen and Jensen (1975), which was carried out at the Royal Veterinary and Agricultural University (KVL) in Denmark.
The primary assumption in the Kristensen and Jensen (KJ) method is Actual Evapotranspiration (AET) cannot exceed ET0. The AET is reduced primarily by insufficient water in the root zone and by the density of the vegetation. In MIKE SHE, the current moisture content in the root zone is the limiting factor for AET in a time step. The root depth defines the depth to which ET can be extracted, and the Leaf Area Index (LAI) is the measure of the density of the vegetation.
The KJ method is based on empirical equations derived from field measurements. The model generally assumes the temperature to be above freezing.
MIKE SHE uses the Crop Reference ET rate for all calculations of ET. The Crop Reference ET rate is:
\(ET_{rate} = ET_{crop} = ET_{ref} \cdot K_c\)
1. Plant Transpiration
The transpiration from the vegetation, Eat, depends on the density of the vegetation, (i.e. the leaf area index, LAI) the soil moisture content in the root zone and the root density. Thus,
Equation 21.4:
\(E_{at} = f_1(LAI) \cdot f_2(\theta) \cdot RDF \cdot ET_{crop}\)
where
- \(E_{at}\) is the actual transpiration [LT-1]
- f1(LAI) is a function based on the leaf area index [-]
- f2(\(\theta\)) is a function based on the soil moisture content in the root zone [-]
- RDF is a root distribution function [-].
f1(LAI)
The function, f1(LAI), expresses the dependency of the transpiration on the leaf area of the plant by (see Figure 21.1)
Equation 21.5:
\(f_1(LAI) = C_2 + C_1LAI\)
where C1 and C2 are empirical parameters [-].
f2(\(\theta\))
The second function, f2(\(\theta\)), is given by
Equation 21.6
\(f2(\theta) = 1 - (\frac{\theta_{FC}-\theta}{\theta_{FC}-\theta_{W}})\)
where
- \(\theta_{FC}\) is the volumetric moisture content at field capacity [-]
- \(\theta_{W}\) is the volumetric moisture content at the wilting point [-]
- \(\theta\) is the actual volumetric moisture content [-]
- C3 is an empirical parameter [LT-1].
As illustrated in Figure 21.2 higher values of C3 will lead to higher values of transpiration, which means that the soil will dry out faster, assuming all other factors constant. In a simulation, the actual transpiration will decrease more quickly for larger values of C3.
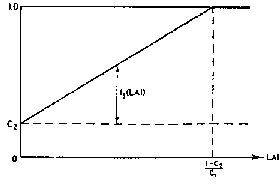
Figure 21.1: The function f1 versus LAI.
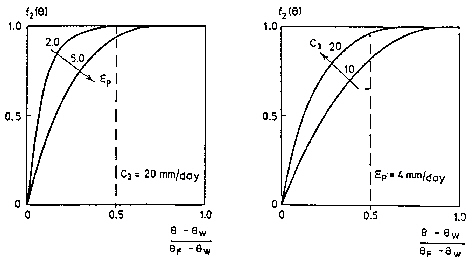
Figure 21.2:The soil moisture function f2(\(\theta\)) for constant C3 (20 mm/day) and varying Ep (left), and for constant \(ET_{crop}\) (4 mm/day) and varying C3 (right).
a. Root Distribution Function, RDF
Water extraction by the roots for transpiration varies over the growing season. In nature, the exact root development is a complex process, which depends on the climatic conditions and the moisture conditions in the soil.
Thus, MIKE SHE allows for a user-defined, time-varying root distribution determined by the root depth (time varying) and a general, vertical root-density distribution, see Figure 21.3.
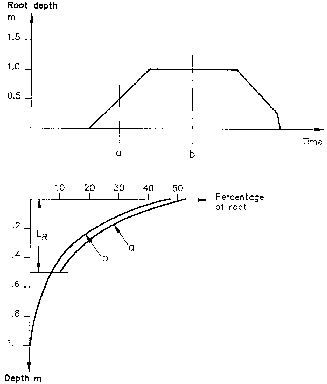
Figure 21.3:Root distribution in time and with depth.
The root extraction is assumed to vary logarithmically with depth by (see Figure 21.3)
Equation 21.7
\(R(z) = R(0) / 10^{A_{ROOT} \cdot z}\)
where
- \(R(0) = 1\)
- \(A_{ROOT}\) is a parameter that describes the root mass distribution [-]
- \(z\) is the depth below ground surface [L].
The value of the Root Distribution Function, RDF, in each layer is then calculated by dividing the amount of water extracted in the layer by the total amount of water extracted by the roots. Thus,
Equation 21.8:
\(RDF_i = {\int\limits_{z_1}^{z_2} R(z)dz} /{\int\limits_{0}^{L_R} R(z)dz}\)
where the numerator is the total amount of water extracted in layer i bounded above by \(Z_1\) and below by \(Z_2\) and the denominator is the total amount of water extracted by the roots between the ground surface and the maximum root depth, LR.
b. AROOT
How the water extraction is distributed with depth depends on the AROOT parameter. Figure 21.4 shows the distribution of transpiration for different values of AROOT, assuming that the transpiration is at the potential rate with no interception loss (Cint=0) and no soil evaporation loss (C2=0). The figure shows that the root distribution, and the subsequent transpiration, becomes more uniformly distributed with depth as AROOT approaches 0. During simulations, the total actual transpiration tends to become smaller for higher values of AROOT because most of the water is drawn from the upper layer, which subsequently dries out faster. The actual transpiration, therefore, becomes more dependent on the ability of the soil to conduct water upwards (capillary rise) to the layers with high root density.
Figure 21.5 shows the effect of the root depth, given the same value of AROOT. A shallower root depth will lead to more transpiration from the upper unsaturated zone layers because a larger proportion of the roots will be located in the upper part of the profile. However, again, this may lead to smaller actual transpiration, if the ability of the soil to conduct water upwards is limited.
Thus, the factors AROOT and root depth are important parameters for estimating how much water can be drawn from the soil profile under dry conditions.
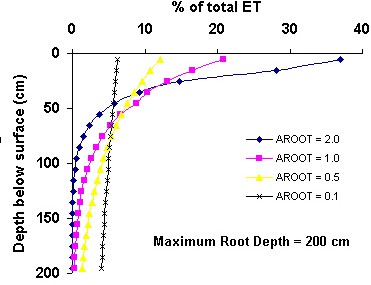
Figure 21.4:Fraction of ET extracted as a function of depth for different values of AROOT.
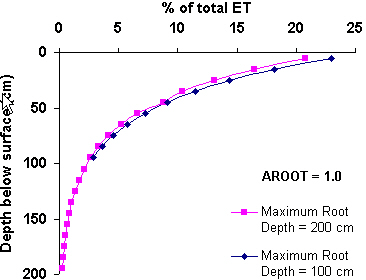
Figure 21.5:Fraction of ET extracted as a function of depth for different maximum root depths.
c. ET distribution between UZ and SZ
Evapotranspiration is extracted from saturated groundwater only when the roots are in contact with the water table - that is, when the root zone is connected to the water table. This can happen in two ways.
- The first is when the water table is physically in the root zone. In most natural systems this will only occur temporarily. If the roots are submerged for any length of time the roots will be starved of oxygen and drown.
- More commonly, the roots reach the capillary fringe. In this case, the evapotranspiration from the capillary fringe is replaced by water from the saturated zone.
In both cases the Kristensen and Jensen method calculates the ET from the subsurface. The MIKE SHE UZ module distributes this ET between the UZ and SZ cells.
In the first case, the ET is simply divided between the UZ and SZ depending on the fraction that would be removed from UZ cells that are below the water table.
In the second case, Richards Equation takes care of the natural replacement of water from the saturated zone by capillarity. However, the Gravity Flow method will ignore capillarity and the lower root zone may become too dry.
2. Soil Evaporation
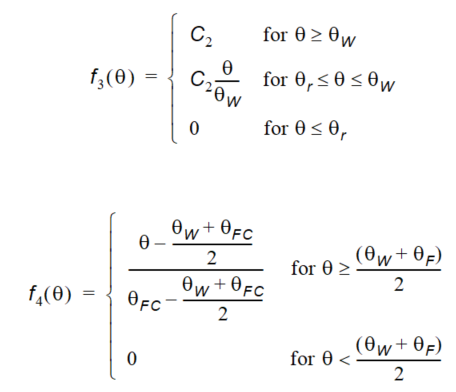
Soil evaporation, Es, occurs from the upper part of the unsaturated zone and consists of a basic amount of evaporation, \(ET_{crop}\). \(f_3(\theta)\), plus additional evaporation from excess soil water as the soil saturation reaches field capacity. This can be described by the following function:
Equation 21.9:
\(E_s = ET_{crop} \cdot f_3(\theta) + (ET_{crop} - E_{at} - ET_{crop} \cdot f_3(\theta) \cdot f_4(\theta) \cdot (1-f_1(LAI))\)
where \(ET_{crop}\) is the reference evapotranspiration, Eat is the actual transpiration (Eq. 21.4), f1 (LAI) is from Eq. (21.5) and the functions \(f_3(\theta)\) and \(f_4(\theta)\) are given by
Equation 21.10:
In the absence of vegetation f1(LAI) can be set to zero and Eat in Eq. (21.9) goes to zero. This allows us to see how Es varies in relation to \(ET_{crop}\) for different values of q. Thus, Eq. (21.9) can be simplified to
\(\frac{E_s}{ET_{crop}} = f_3(\theta) + f_4(\theta) - f_3(\theta) f_4(\theta)\)
which is plotted in Figure 21.6.
In the MIKE SHE, soil evaporation is restricted to the upper node in the unsaturated zone, which, generally, should be about 10 centimetres deep, or less.
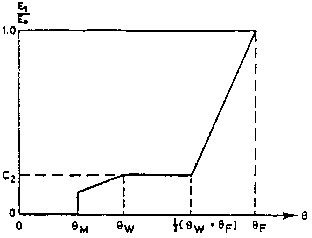
Figure 21.6:Soil evaporation Es in relation to \(ET_{crop}\) as a function of q in the top layer when f(LAI) = 0.
3. Evapotranspiration Coefficients C1, C2 and C3
The equations for actual transpiration, Eq. (21.4), and soil evaporation, Eq. (21.9), contain three empirical coefficients, C1, C2, and C3. The coefficients C1 and C2 are used in the transpiration function, f1(LAI) (Eq.(21.5). C3 is also part of Eq. (21.4), but is only found in the soil moisture function, Eq. (21.6).
C1
C1 is plant dependent. For agricultural crops and grass, C1 has been estimated to be about 0.3. C1 influences the ratio soil evaporation to transpiration. This is illustrated in Figure 21.7. For smaller C1 values the soil evaporation becomes larger relative to transpiration. For higher C1 values, the ratio approaches the basic ratio determined by C2 and the input value of LAI.
C2
For agricultural crops and grass, grown on clayey loamy soils, C2 has been estimated to be about 0.2. Similar to C1, C2 influences the distribution between soil evaporation and transpiration, as shown in Figure 21.8. For higher values of C2, a larger percentage of the actual ET will be soil evaporation. Since soil evaporation only occurs from the upper most node (closest to the ground surface) in the UZ soil profile, water extraction from the top node is weighted higher. This is illustrated in Figure 21.8, where 23 per cent and 61 per cent of the total extraction takes place in the top node for C2 values of 0 and 0.5 respectively.
Thus, changing C2 will influence the ratio of soil evaporation to transpiration, which in turn will influence the total actual evapotranspiration possible under dry conditions. Higher values of C2 will lead to smaller values of total actual evapotranspiration because more water will be extracted from the top node, which subsequently dries out faster. Therefore, the total actual evapotranspiration will become sensitive to the ability of the soil to draw water upwards via capillary action.
C3
C3 has not been evaluated experimentally. Typically, a value for C3 of 20 mm/day is used, which is somewhat higher than the value of 10 mm/day proposed by Kristensen and Jensen (1975). C3 may depend on soil type and root density. The more water released at low matrix potential and the greater the root density, the higher should the value of C3 be. Further discussion is given in Kristensen and Jensen (1975).
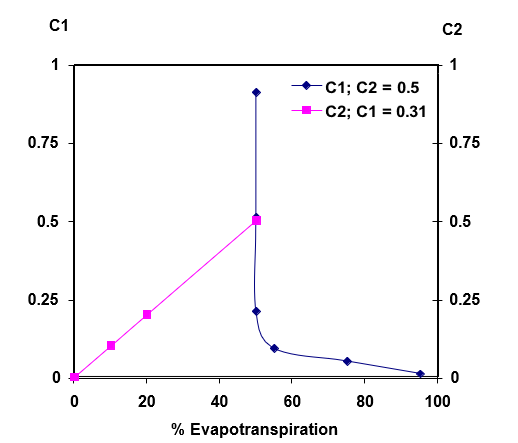
Figure 21.7:The influence of the C1 and C2 on the ratio between soil evaporation and transpiration. The values were obtained from model runs assuming Cint = 0, the moisture content above field capacity, and LAI = 5
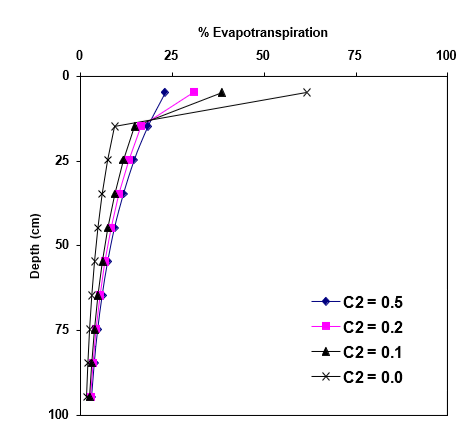
Figure 21.8:Distribution of actual evapotranspiration (in per cent) over depth for different values of C2. C2=0 corresponds to pure transpiration.