Physics of Unsaturated Zone Flow
1. Overview
The Unsaturated Zone (UZ) is generally considered the area between the land surface and the groundwater water table. The UZ is characterized by cyclic fluctuations in soil moisture as water is replenished by rainfall and removed by evapotranspiration and percolates to the groundwater table as recharge.
The flow of water in the UZ depends on the interplay between three processes:
- Infiltration from the land surface into the soil,
- Evapotranspiration (ET) from the root zone, and
- Flow in the soil pores and deep percolation to the groundwater table.
The entire amount of rainfall will infiltrate into the soil surface if the rate of rainfall is less than the maximum infiltration rate. Generally, the maximum rate of infiltration is when the soil is saturated.
The UZ is coincident with the root zone, which is normally always above the water table. Most plants can tolerate short periods of fully saturated conditions in their roots, but if the roots are saturated for longer periods the roots will typically die off. Thus, nearly all plant ET occurs in the UZ.
The only extraction of water in the unsaturated zone is ET, the water content in the soil below the root zone is in equilibrium with the rate of drainage.
Thus, any infiltration that exceeds the capacity of the roots to extract it will percolate past the root zone and eventually become groundwater recharge.
The UZ is generally differentiated from the Saturated Zone by the presence of air in the soil pores. Thus, the key characteristic of the UZ is the amount of water in the soil pores, or the water content. From this we can define several characteristic water contents:
- Saturated water content, \(\theta_s\), is equal to the porosity. This is the maximum amount of water that can be present in the soil.
- Field capacity, \(\theta_{fc}\), is amount of water in the soil after it has freely drained and when there is no evapotranspiration. Essentially, the water content is in equilibrium. It is an equilibrium between gravity drainage and the ability of the soil to hold on to moisture.
- Wilting point, \(\theta_{wp}\), is the minimum water content below which plants can no longer extract water from the soil using osmotic pressure. This is defined as a soil suction of -1500 KPa (-15 bar, pF 4.18).
- Residual water content, \(\theta_r\), is the effective minimum water content for a ‘dry’ soil.
Interestingly, Field Capacity is the language of the agronomist or soil scientist, where it is related to the plant available water. However, the related Specific Yield is a groundwater term. As defined by a hydrogeologist, Specify Yield is the amount of water that can be abstracted from an unconfined groundwater aquifer as the water table declines due to pumping. In other words, the specific yield is the saturated water content minus the field capacity. This has been recognized for nearly 100 years evidenced by Figure 32.1, which is from a 1963 USGS report, which itself references the figure from a publication from 1934.
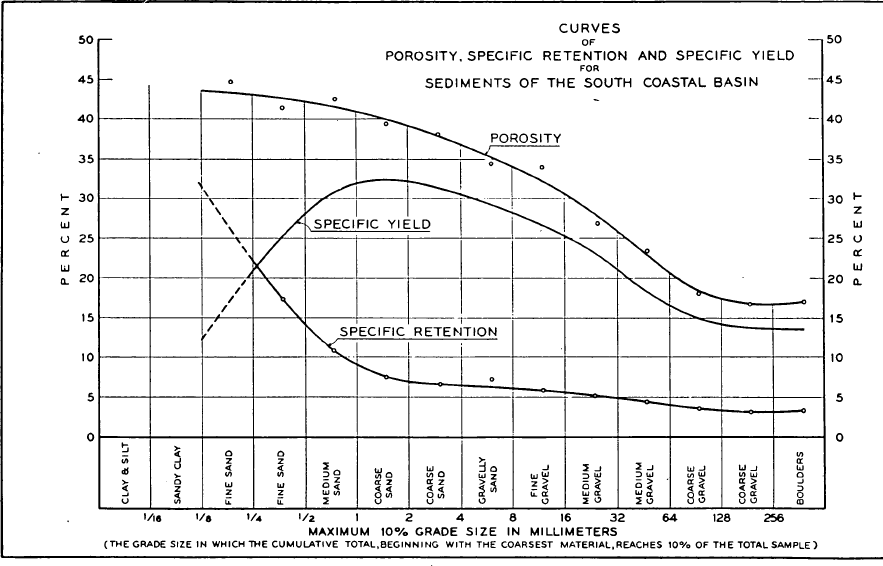
Figure 32.1 Relation between Specific Yield, Porosity and Field Capacity (from USGS OFR 63-59, Figure 3)
Note
In MIKE SHE the Specific Yield of the uppermost SZ layer is set equal to \(\theta_s\) - \(\theta_{fc}\) at the beginning of the simulation. However, this is only done at the beginning.
2. The saturation-pressure function
The relationship between the water content, \(\theta\) and the matric potential, \(\psi\) is known as the soil moisture retention curve, which is basically a function of the texture and structure of the soil. The amount and type of organic material may also have an influence on the relationship. Characteristically, the pressure head decreases rapidly as the moisture content decreases. Hysteresis is also common, that is the relationship between \(\theta\) and \(\psi\) is not unique but depends on whether the moisture content is increasing or decreasing. MIKE SHE allows for any shape of the soil moisture retention curve but does not take hysteresis into account (i.e. a unique relation between \(\theta\) and \(\psi\) is assumed).
Typically, the soil moisture curve is measured in a laboratory or assumed based on typical values for similar soils. If laboratory data is available, the measured \(\theta\) - \(\psi\) values can be input directly into MIKE SHE as tabular data.
Intermediate values are then calculated by MIKE SHE, using a cubic spline method, and stored internally in the code. Alternatively, the measured values can be fitted to commonly used functional relationships. The appropriate function parameters can be input directly, or more refined tabular data may be generated externally to MIKE SHE (e.g. in MS Excel) and input as tabular data.
Several parametric forms of the soil moisture retention curve have been developed over the years. The MIKE SHE interface allows the user to specify two of the most common parametric forms.
See Soil Moisture Retention Curve.
3. Hydraulic conductivity as a function of saturation
The Governing Equation for the unsaturated flow requires information about two hydraulic functions: The hydraulic conductivity function, \(K(\theta)\) and the soil moisture retention curve \(\psi(\theta)\) are important.
The hydraulic conductivity decreases strongly as the moisture content \(\theta\) decreases from saturation. This is not surprising since the total cross-sectional area for the flow decreases as the pores are getting filled with air. In addition, when a smaller part of the pore system is available to carry the flow, the flow paths will become more tortuous. Also, there is an increase of the viscosity of the water, when the short-range adsorptive forces become dominant in relation to the capillary forces.
The experimental procedure for measuring the \(K(\theta)\) function is rather difficult and not very reliable. Alternatively, procedures have been suggested to derive the function from more easily measurable characterizing properties of the soil or simply to rely on empirical relationships.
Reviews of various methods for predicting the conductivity function can be found in the literature.
See Hydraulic Conductivity Function.
4. Typical soil parameters
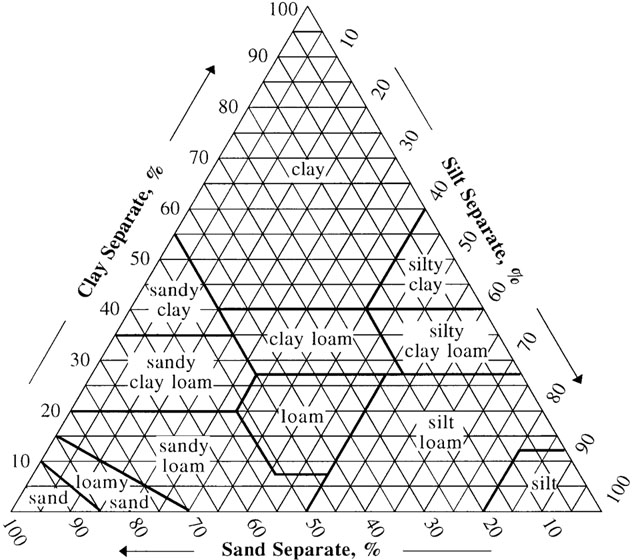
Figure 32.2 USDA Soil texture classification by grain size distribution
5. UZ Soils Editor
The UZ Soils Editor is used to define the saturation-pressure and the saturation-conductivity soil functions.
See UZ Soil Properties Editor.
Note
The units of pressure in the UZ Soils Editor are pF. This is defined as the base 10 logarithm of the suction expressed in cm of water. To convert between MPa and pF, first convert MPa to cm of water. The conversion factor is 10200 cm/MPa. Drop the negative sign because you cannot take the logarithm of a negative number. Finally, take the base 10 logarithm to get pF. For example, -1 MPa equals pF 4.01.